Duval vs. St. Johns, Clay, Nassau and Baker Counties: Pay, Home Prices, Rent and Growth Compared
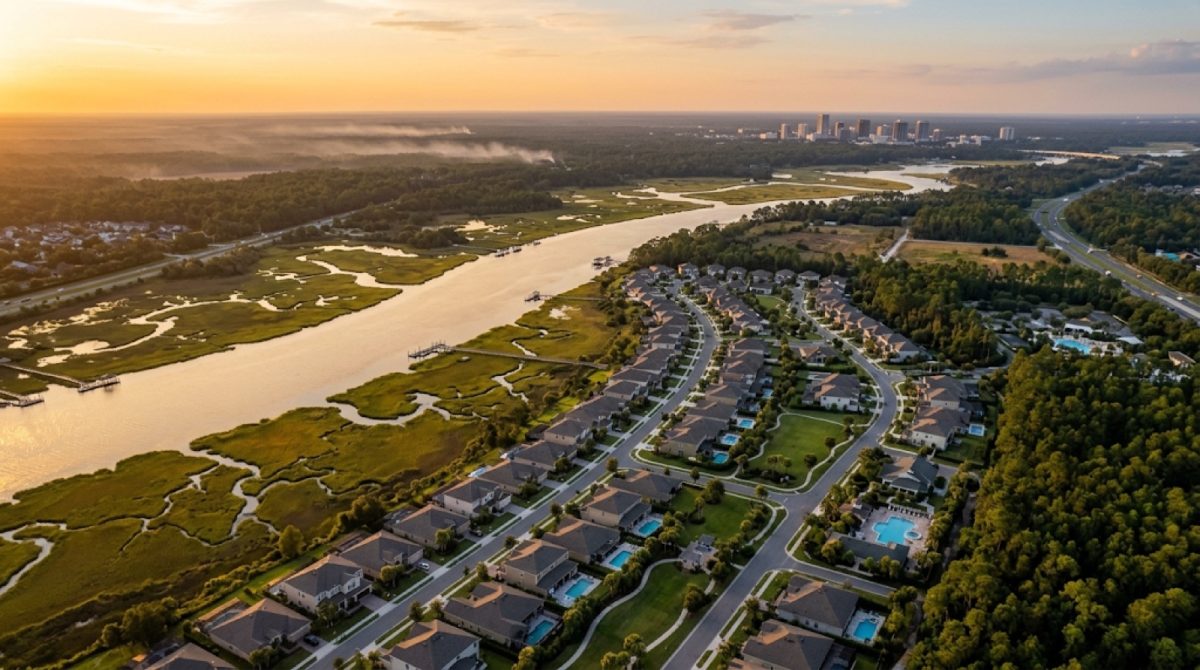
St. Johns County grew 26.7% from 2020 to 2025, the fastest of Northeast Florida's five counties. Illustration: AI-generated
Jacksonville, Fla. — St. Johns County has the highest median household income and fastest population growth among five Northeast Florida counties, while Duval County has the most jobs and building permits. Baker County has the lowest median home value and rent, according to figures compiled by the U.S. Census Bureau.
The comparison covers Duval, St. Johns, Clay, Nassau and Baker counties. It shows how living costs and growth differ across the region, even as all five counties have gained population since 2020.
The five counties side by side
Population figures are estimates for July 1, 2025. Income and housing figures come from the 2020-2024 American Community Survey, with dollar figures expressed in 2024 dollars.
| County | 2025 population | Growth since 2020 | Median household income | Median home value | Median gross rent |
|---|---|---|---|---|---|
| Duval | 1,062,963 | +6.8% | $71,277 | $303,500 | $1,475 |
| St. Johns | 346,328 | +26.7% | $109,839 | $489,200 | $1,922 |
| Clay | 239,593 | +9.8% | $87,820 | $312,500 | $1,551 |
| Nassau | 106,879 | +18.3% | $89,804 | $382,800 | $1,526 |
| Baker | 29,737 | +5.2% | $79,836 | $256,700 | $1,302 |
The numbers are countywide medians and estimates, not prices or incomes for every household or community. Comparing the measures together offers a fuller picture than judging a county by one figure.
St. Johns leads in pay, but housing costs more
St. Johns County's median household income is $109,839, the highest of the five counties. That is $38,562 more than Duval County's $71,277.
The housing difference is also considerable. St. Johns has a median owner-occupied home value of $489,200, which is $185,700 higher than Duval's $303,500. Its median gross rent is $1,922 monthly, compared with $1,475 in Duval.
For homeowners with a mortgage, median monthly owner costs are $2,351 in St. Johns and $1,753 in Duval. The St. Johns homeownership rate is 82.2%, compared with 58.2% in Duval.
St. Johns also has the highest share of adults with at least a bachelor's degree at 50.9%, and the lowest poverty rate at 5.8%. Those figures add context to the income differences, without establishing why an individual household earns more or less.
Baker has the lowest home values and rents
At $256,700, Baker County's median home value is the lowest among the five. Its median gross rent of $1,302 is also the lowest.
Baker's median monthly ownership cost with a mortgage is $1,528, below the comparable amounts in Duval, St. Johns, Clay and Nassau. Its homeownership rate, however, is the highest in the group at 85.1%.
The county has an estimated 29,737 residents, far fewer than its neighbors in the comparison. Its median household income is $79,836, above Duval's $71,277, while its poverty rate of 13.0% is the highest of the five.
Those measures show why the county with the least expensive median housing is not necessarily the county with the lowest median household income.
All five counties grew, but at different speeds
St. Johns County's population grew 26.7% since 2020, reaching an estimated 346,328 residents in July 2025. Nassau County followed with 18.3% growth and an estimated population of 106,879.
Clay increased 9.8%, Duval grew 6.8%, and Baker gained 5.2%. Duval remains the largest county by a wide margin, with an estimated 1,062,963 residents.
Construction figures help illustrate the scale of recent development, though they cover a different time period. Duval recorded 6,017 building permits in 2025, the most among the counties. St. Johns followed with 4,735 permits, compared with 1,522 in Clay, 1,060 in Nassau and 121 in Baker.
A higher permit count is not the same measure as faster percentage population growth. Duval leads in permits, while St. Johns leads in population growth rate.
Duval remains the biggest employment center
Duval County recorded 508,104 jobs in 2023, substantially more than any of the other four counties. St. Johns had 80,082, Clay had 48,303, Nassau had 21,651 and Baker had 6,203.
These employment totals are based on jobs located in each county rather than the number of residents who have jobs. That difference matters in a region where the location of work and the location of home can be different.
Duval also had the highest retail sales per capita in the comparison, at $28,932 in 2022. St. Johns recorded $17,639, Baker $14,437, Nassau $13,341 and Clay $12,933.
Duval's population includes 80,475 veterans, the largest veteran count of the five counties. Clay follows with 27,517, St. Johns with 23,534, Nassau with 8,635 and Baker with 1,433.
Clay residents have the longest average commute
Clay County's mean travel time to work is 31.3 minutes, the longest in this comparison. Nassau follows at 30.1 minutes, Baker at 29.9 minutes and St. Johns at 26.9 minutes.
Duval has the shortest average commute at 24.1 minutes. The averages describe reported travel times, not how long every resident spends getting to work.
Nassau also stands apart in age distribution. Residents 65 and older make up 26.7% of its population, the highest share among the five counties. St. Johns follows at 22.5%, while Clay is at 18.8%, Duval at 17.3% and Baker at 17.2%.
For households comparing counties, rent, purchase prices, ownership costs and commuting figures may point in different directions. The figures describe broad county patterns rather than a single choice that fits every resident.
How we did this
Jax Times compared U.S. Census Bureau QuickFacts figures for Duval, St. Johns, Clay, Nassau and Baker counties, reviewed Oct. 23, 2026. Population estimates are dated July 1, 2025, while income, housing, education, poverty, veteran and commute figures come from the 2020-2024 American Community Survey. Dollar figures use 2024 values.
Building permits reflect 2025, employment counts are from 2023, and retail sales are from 2022. The comparison uses only those published county-level figures and arithmetic differences between them.
Source: U.S. Census Bureau QuickFacts (2025 population estimates; 2020-2024 American Community Survey)

News organizations may republish this story with credit. See our guidelines.
Know someone who'd want to read this? Email it to a friend.
Own a Jacksonville business? Introductory ad rates from $125/month. See ad optionsPlan your weekend with Jax Times
Get This Weekend in Jacksonville every Thursday: the best local events, free things to do and family fun, plus each evening's local news. Free, and you can unsubscribe anytime.
Most read this week
- Florida's 3 Constitutional Amendments on the Nov. 3 Ballot, Explained in Plain English
- Florida Is Holding $3 Billion in Unclaimed Money. Here's How Jacksonville and St. Augustine Residents Can Search for Free
- Fire Destroys Golf Carts of St. Augustine Building on U.S. 1: What We Know, What Happens Next and 9 Golf Cart Battery Safety Rules
- St. Augustine Artist Dara Dodson Paints 'A Land Remembered,' With Shows at the Karpeles Museum and the St. Augustine Art Association
- St. Augustine Parking in 2026: 12 Questions About the $20 Garage, $3 Resident Rate and Cheaper Options
More stories
 Sports Jacksonville Jaguars History by the Numbers: 10 Milestones, From 1995 to a 13-Win Season
 Local Hurricane Dora Hit St. Augustine With 110 MPH Winds in 1964 and Left Jacksonville Without Power for Days
 Arts & Culture Jacksonville Had More Than 30 Silent Film Studios. Here's Why Hollywood Left and What's Still Standing
 Food 33 Jacksonville Fast-Food Chains Ranked by Health Inspections: Five Guys Had the Fewest Violations, Krystal the Most
Comments
Be respectful. No personal attacks, hate speech, spam or anyone's private information. Every comment is reviewed before it appears. Comment rules
No comments yet. Be the first to share your thoughts.