JAXPORT by the Numbers: Jacksonville Port's Last 5 Years Ranked, From 9.96 Million to 10.35 Million Tons
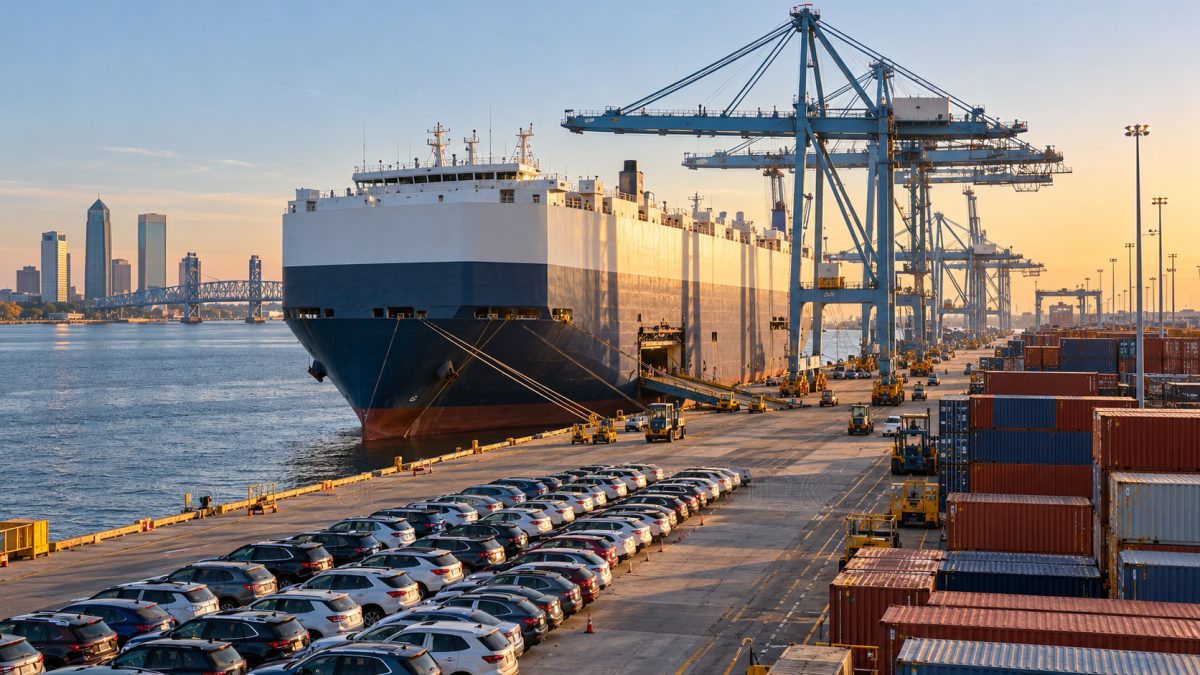
JAXPORT handled 10.23 million tons of cargo and 1.39 million container units in fiscal 2025. Illustration: AI-generated
Jacksonville, Florida, handled its largest cargo volume of the past five completed fiscal years in 2023, when 10,352,713 tons moved through JAXPORT. The port's latest completed fiscal year, 2025, shows slightly less tonnage at 10,230,114 tons but 1,388,841 container units, its most since fiscal 2021.
The numbers tell a more interesting story than a simple increase or decrease in business. Jacksonville's port handled fewer automobiles in 2025 than in 2021, reached a five-year high in vessel visits, and recorded more than 200,000 embarking cruise passengers for the second consecutive year.
JAXPORT publishes annual statistics for cargo weight, container traffic, vehicle units, ship calls and cruise activity. Those figures make it possible to compare how the port's business has changed rather than relying on announcements about individual projects.
Here are the five fiscal years ranked from lowest to highest total cargo tonnage, followed by the trends that stand out.
First, what exactly is JAXPORT measuring?
JAXPORT's fiscal year begins Oct. 1 and ends Sept. 30. The five years in this comparison are fiscal 2021 through fiscal 2025, rather than calendar years.
The port tracks cargo using several measures that describe different kinds of activity. Tonnage represents cargo weight, while containers are counted in twenty-foot equivalent units, commonly abbreviated TEUs.
One TEU represents the capacity of a standard 20-foot container. This standardized measurement allows the port to report container activity even when containers come in different sizes.
Automobiles are also counted individually, while cruise statistics report embarking passengers. An embarking passenger is someone beginning a cruise at the port, so that figure should not be confused with a count of everyone arriving and departing.
The cargo-tonnage ranking below uses JAXPORT's official total tonnage figure for each fiscal year. Container units, automobiles and embarking cruise passengers are included separately.
The five JAXPORT cargo years, ranked
| Rank | Fiscal year | Total cargo tons | Container TEUs | Automobiles | Embarking cruise passengers |
|---|---|---|---|---|---|
| 5 | 2022 | 9,960,166 | 1,298,132 | 553,029 | 90,241 |
| 4 | 2024 | 10,051,499 | 1,340,412 | 509,091 | 206,720 |
| 3 | 2025 | 10,230,114 | 1,388,841 | 506,237 | 200,548 |
| 2 | 2021 | 10,338,160 | 1,407,310 | 616,215 | 0 |
| 1 | 2023 | 10,352,713 | 1,313,487 | 505,665 | 190,872 |
Source: JAXPORT official annual cargo and cruise statistics. TEUs and automobiles are unit counts, not tons. Cruise figures count embarking passengers.
The ranking illustrates how the port's various businesses do not necessarily rise or fall together. One year can lead in cargo weight while another leads in containers, automobiles or cruise passengers.
No. 5: Fiscal 2022 — 9,960,166 tons
Fiscal 2022 ranks fifth, with just under 10 million tons of cargo. The port reported 1,298,132 container TEUs, 553,029 automobiles and 1,567 cargo vessel calls.
The year was also significant for cruise activity because embarkations resumed after the previous fiscal year recorded none. JAXPORT reported 90,241 embarking cruise passengers and 52 cruise vessel calls in fiscal 2022.
Cargo tonnage was 377,994 tons lower than fiscal 2021, calculated from the port's published totals. Container volume also declined by 109,178 TEUs, while automobile units fell by 63,186.
The cargo breakdown shows 6,579,569 tons of containerized goods, 1,243,067 tons of bulk cargo and 968,045 tons of breakbulk cargo. Automobiles represented another 1,169,357 tons.
Although fiscal 2022 ranks last in this five-year comparison, it still involved substantial container, automobile and vessel activity. Its position illustrates the relatively narrow range of total tonnage across the period.
No. 4: Fiscal 2024 — 10,051,499 tons
Fiscal 2024 ranks fourth, with 10,051,499 tons. That was 301,214 tons below fiscal 2023, despite increases in some other measures.
Container traffic reached 1,340,412 TEUs, up from 1,313,487 in 2023. Automobile units also increased slightly, from 505,665 to 509,091.
Cruise activity reached the highest level in the five-year dataset. JAXPORT recorded 206,720 embarking passengers and 80 cruise vessel calls, compared with 190,872 passengers and 76 cruise calls in 2023.
JAXPORT reported approximately $70 million in operating revenue during fiscal 2024, according to its fiscal 2025 annual report.
The comparison demonstrates that cargo weight alone cannot fully describe a port's financial or operational performance.
No. 3: Fiscal 2025 — 10,230,114 tons
Fiscal 2025 ranks third for total cargo tonnage, at 10,230,114 tons. It nevertheless led the five-year period in container TEUs and cargo vessel calls.
JAXPORT handled 1,388,841 TEUs, an increase of 48,429 over fiscal 2024. Cargo vessel calls reached 1,611, compared with 1,569 the year before.
Automobile units slipped to 506,237, from 509,091 in 2024. Cruise embarkations also declined slightly, to 200,548 passengers, while cruise vessel calls decreased from 80 to 79.
The annual cargo breakdown shows 6,571,779 tons of containerized freight, 1,486,514 tons of bulk cargo, 975,928 tons of breakbulk freight and 1,204,437 tons associated with automobiles.
Breakbulk cargo increased from 807,714 tons in fiscal 2024 to 975,928 tons in fiscal 2025. JAXPORT's financial report identifies growth in this business and says breakbulk revenue increased from $4.8 million to $7.1 million.
The authority also reported approximately $76 million in operating revenue, a 9% increase over the previous year's $70 million. That increase occurred while automobile unit counts and cruise embarkations declined.
Fiscal 2025 illustrates why the port's different measures deserve separate attention. Total tonnage was not the five-year record, but container volumes and vessel calls reached their highest levels in the period.
No. 2: Fiscal 2021 — 10,338,160 tons
Fiscal 2021 ranks second in cargo weight, at 10,338,160 tons. It led the five-year period in automobile units and, narrowly, in container TEUs over fiscal 2025.
JAXPORT reported 616,215 automobiles, the largest annual total in the comparison. Its 1,407,310 TEUs also exceeded fiscal 2025's 1,388,841 units by 18,469.
Containerized cargo accounted for 7,060,495 tons. Automobile cargo represented another 1,306,047 tons, while bulk cargo totaled 1,239,517 tons and breakbulk cargo totaled 728,300 tons.
The port recorded 1,521 cargo vessel calls, the fewest of the five fiscal years. That contrast shows why the number of ship visits should not be used as a substitute for total cargo weight.
Cruise statistics tell a different story. JAXPORT recorded zero embarking cruise passengers and zero cruise vessel calls during fiscal 2021.
That zero is an official reported figure, not missing data. It is included in the comparison because the port's published statistics identify no cruise embarkations during that fiscal year.
Fiscal 2021 therefore ranked near the top in cargo while having no embarking cruise activity. Cargo and cruise operations followed distinctly different patterns.
No. 1: Fiscal 2023 — 10,352,713 tons
Fiscal 2023 ranks first, with 10,352,713 tons moving through JAXPORT. It exceeded fiscal 2021 by 14,553 tons, making those two years exceptionally close in total cargo weight.
Container volume reached 1,313,487 TEUs, while automobile traffic totaled 505,665 units. Neither measure led the five-year period, even though fiscal 2023 recorded the greatest total cargo tonnage.
The cargo breakdown explains part of the difference. JAXPORT reported 1,988,141 tons of bulk cargo, the highest bulk total in the five-year table.
The port also handled 6,377,479 tons of containerized cargo, 843,397 tons of breakbulk freight and 1,143,636 tons of automobile cargo.
Cruise traffic continued its recovery, reaching 190,872 embarking passengers and 76 cruise vessel calls. That was more than double the 90,241 embarking passengers reported in fiscal 2022.
The port recorded 1,566 cargo vessel calls, almost unchanged from the previous year's 1,567. Yet its total cargo tonnage increased by 392,547 tons.
That is a useful reminder that cargo weight depends on what ships carry, not simply how many vessels visit.
Which year really had the most containers?
The answer depends on the exact period being compared. Within fiscal 2021 through fiscal 2025, the largest total was 1,407,310 TEUs in 2021, followed closely by 1,388,841 in 2025.
Fiscal 2025 was the strongest container year since fiscal 2021, not the absolute leader in this five-year dataset.
| Fiscal year | Container TEUs |
|---|---|
| 2021 | 1,407,310 |
| 2022 | 1,298,132 |
| 2023 | 1,313,487 |
| 2024 | 1,340,412 |
| 2025 | 1,388,841 |
Container volume declined in 2022, then increased in each of the next three fiscal years. From the fiscal 2022 low to the fiscal 2025 total, the gain was 90,709 TEUs.
JAXPORT's annual report describes modernization of the SSA Jacksonville container terminal, including work on a 93-acre facility. The project was completed during fiscal 2025 and was intended to support additional international cargo capacity.
The annual report also describes new cranes for the terminal, with commissioning in early fiscal 2026. These improvements are part of its strategy to handle container traffic, although the historical figures alone cannot establish how much of any increase resulted from a particular construction project.
What happened to Jacksonville's automobile business?
Automobile units show a different five-year pattern from container traffic. JAXPORT recorded 616,215 vehicles in fiscal 2021, compared with 506,237 in fiscal 2025.
That represents a decline of 109,978 vehicles, or approximately 17.8%, calculated from the authority's figures.
| Fiscal year | Automobile units |
|---|---|
| 2021 | 616,215 |
| 2022 | 553,029 |
| 2023 | 505,665 |
| 2024 | 509,091 |
| 2025 | 506,237 |
Automobile volume declined in 2022 and 2023, increased modestly in 2024, and slipped again in 2025. The five-year data do not identify one single cause for the overall decline.
JAXPORT's annual financial report does document construction affecting its automotive facilities. The Southeast Toyota Distributors project involved an 89-acre vehicle-processing facility that was completed and became fully operational Dec. 1, 2025, during fiscal 2026.
The authority also describes construction of an additional roll-on/roll-off berth associated with vehicle cargo operations. Those facilities form part of the port's infrastructure investment, but their completion occurred after the fiscal 2025 reporting period.
Automobiles remain a significant portion of the port's activity. Its official cargo description identifies cars, trucks, sport utility vehicles, motorcycles and other roll-on/roll-off cargo among the products handled.
Did Jacksonville's cruise business recover?
The five-year records show a substantial rebound in embarking cruise passengers after fiscal 2021, when JAXPORT recorded none. Embarkations reached 90,241 in 2022, increased again in 2023 and reached 206,720 in 2024.
Fiscal 2025 ended with 200,548 embarking passengers, a decline of 6,172 from 2024. Nevertheless, it was the second consecutive fiscal year above 200,000 embarkations.
| Fiscal year | Embarking passengers | Cruise vessel calls |
|---|---|---|
| 2021 | 0 | 0 |
| 2022 | 90,241 | 52 |
| 2023 | 190,872 | 76 |
| 2024 | 206,720 | 80 |
| 2025 | 200,548 | 79 |
These are passengers beginning cruises at Jacksonville, not total cruise passenger movements in both directions. The distinction matters when comparing these statistics with passenger figures published elsewhere.
JAXPORT's financial reports place cruise activity within the authority's broader revenue picture. For fiscal 2025, the authority reported cruise revenue of approximately $7.3 million, about the same as the year before.
Cruise statistics should also be kept separate from cargo vessel statistics. A cruise ship arrival is not counted as a container ship delivering commercial freight in the cargo-vessel table.
Why can cargo tons fall while container traffic rises?
The explanation begins with the difference between weight and units. Container TEUs measure shipping-container capacity, while cargo tonnage measures the weight of materials handled.
A year with more container units does not necessarily involve more cargo weight. The mix of products, the amount carried in each unit, and activity in bulk, breakbulk and automobile cargo all influence the annual total.
JAXPORT reports cargo tonnage in several categories:
| Cargo category | FY2025 tons |
|---|---|
| Containerized | 6,571,779 |
| Bulk | 1,486,514 |
| Automobiles | 1,204,437 |
| Breakbulk | 975,928 |
| Heavy lift | 209 |
| Published total | 10,230,114 |
Containerized cargo includes goods shipped in freight containers. Breakbulk refers to cargo handled separately rather than inside standard shipping containers, including products such as lumber, paper and steel.
Bulk cargo consists of commodities handled in bulk form. Heavy-lift cargo involves particularly large or heavy shipments requiring specialized handling.
JAXPORT's individual cargo categories help explain why a change in one business does not determine the port's overall ranking.
How much economic activity depends on JAXPORT?
The port's importance extends beyond the cargo unloaded at its terminals. According to its published 2024 economic-impact study, cargo activity through Jacksonville's seaport supported more than 258,800 jobs across Florida and generated $44 billion in annual economic impact for the region and state.
The study identified 30,764 port-dependent jobs in the Jacksonville area, including direct, indirect and induced employment connected to cargo activity.
Those two employment measures describe different geographic and economic scopes. The statewide figure should not be presented as the number of people employed at the port's Jacksonville terminals.
The study also reports an average annual salary of $76,706 for port-dependent jobs. That figure describes the employment covered by the study and is not a salary guarantee for workers seeking port-related positions.
JAXPORT's impact estimates demonstrate the broader economic relationships connected to shipping, transportation, distribution and supporting industries. They are separate from the annual cargo statistics used for the five-year ranking.
What should Jacksonville watch next?
Fiscal 2025 closed with higher container volumes and cargo vessel calls than fiscal 2024, alongside lower automobile units and cruise embarkations. Total cargo weight increased by 178,615 tons compared with the previous fiscal year.
JAXPORT's financial report also describes significant infrastructure projects completed or continuing after that reporting period. These include the SSA terminal modernization project, the Southeast Toyota Distributors automotive facility and work related to the St. Johns River overhead powerline clearance.
Such projects are designed to support future operations, but construction spending does not automatically establish how much cargo the port will handle in any particular year.
JAXPORT publishes monthly and annual statistics on its website, allowing residents and businesses to examine new results as they become available. The most meaningful comparison will continue to separate cargo weight, containers, automobiles and cruise traffic rather than treating them as one measure.
Across fiscal 2021 through fiscal 2025, Jacksonville's port remained above 9.9 million tons annually. The highest-weight year was 2023, while 2025 marked a strong container recovery and the most cargo vessel visits in the period.
How we did this
Jax Times reviewed JAXPORT's official statistics for fiscal 2021 through fiscal 2025 and ranked those years by the authority's published total cargo tonnage. Every container TEU, automobile-unit count, cargo vessel count and embarking cruise-passenger figure comes from the same official annual statistics page.
We also consulted JAXPORT's fiscal 2025 and fiscal 2024 financial reports, its cargo-type descriptions and its published economic-impact study for additional context. Differences and percentage changes were calculated from the official figures.
The comparison covers five completed fiscal years ending Sept. 30, 2025. It does not attempt to estimate fiscal 2026 results or combine cargo weight with container units or passenger counts.
Source: Jacksonville Port Authority (JAXPORT) statistics, FY2025 annual report and economic impact study

News organizations may republish this story with credit. See our guidelines.
Know someone who'd want to read this? Email it to a friend.
Own a Jacksonville business? Introductory ad rates from $125/month. See ad optionsPlan your weekend with Jax Times
Get This Weekend in Jacksonville every Thursday: the best local events, free things to do and family fun, plus each evening's local news. Free, and you can unsubscribe anytime.
Most read this week
- Florida's 3 Constitutional Amendments on the Nov. 3 Ballot, Explained in Plain English
- Duval and St. Johns School Calendars 2026-27: Every Day Off Left This School Year, Side by Side
- Florida Is Holding $3 Billion in Unclaimed Money. Here's How Jacksonville and St. Augustine Residents Can Search for Free
- Early Voting in Jacksonville Starts Tuesday: All 24 Sites, the Hours, What to Bring and What's on Your Ballot
- Rent in Jacksonville and St. Johns County by ZIP Code: From $1,216 to $2,897 a Month
More stories
 Local Jacksonville and St. Augustine State Parks: 10 Questions About $3–$8 Admission, Annual Passes and Savings
 Local St. Augustine's 2 Spanish Stone Forts: 1672 Groundbreaking, a 1742 Watchtower and the Sieges That Shaped Florida
 Local Jacksonville Is Overdue for Its First 50-Degree Night: 35 Years of Data on When the Cold Arrives
 Local Jacksonville vs. Tampa, Orlando and Miami: 14 Questions Answered on Pay, Rent and Home Prices
Comments
Be respectful. No personal attacks, hate speech, spam or anyone's private information. Every comment is reviewed before it appears. Comment rules
No comments yet. Be the first to share your thoughts.