Jacksonville Has 803,000 Jobs, but Unemployment Rises to 4.5% as Industries Split
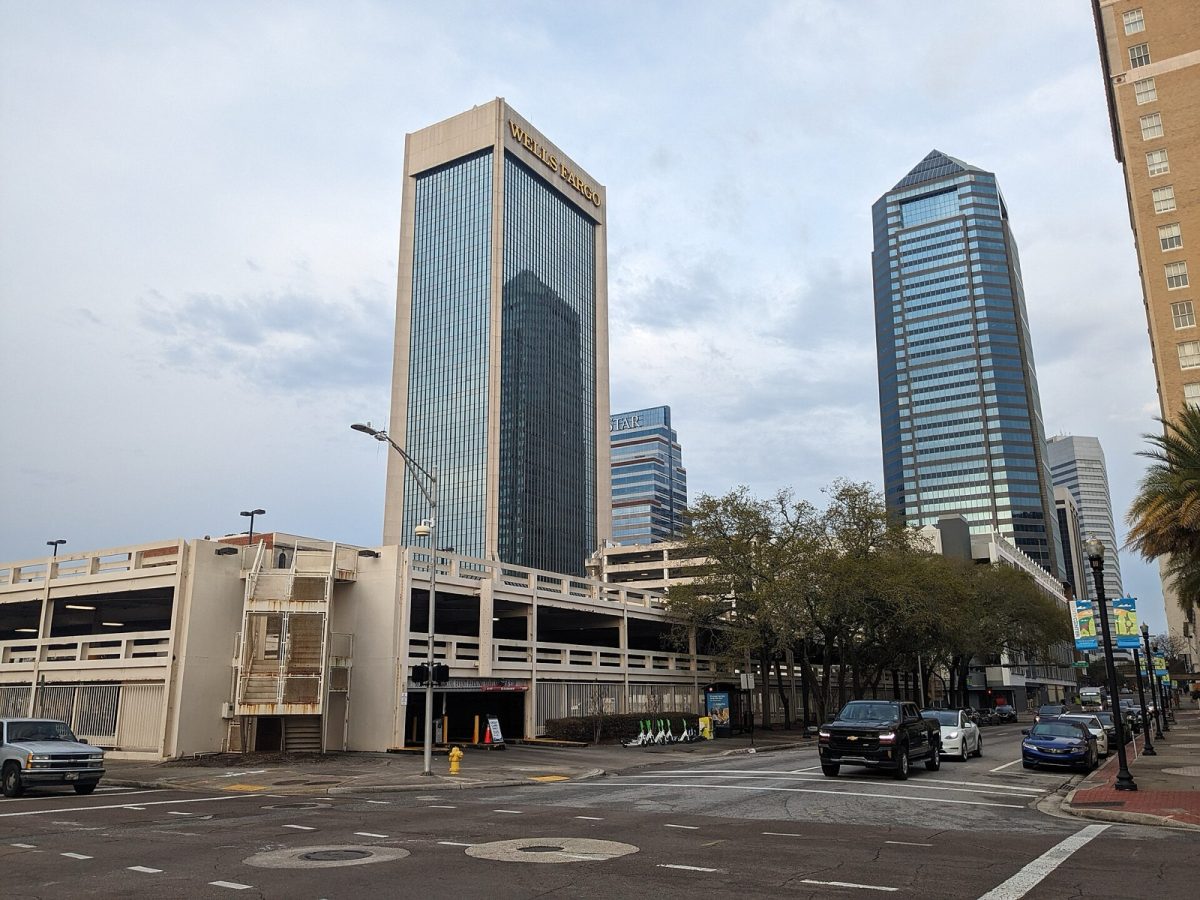
The Jacksonville metro had about 802,800 nonfarm jobs in September 2026, according to preliminary BLS figures. Shown: downtown Jacksonville office towers. Photo: Pokemonprime / Wikimedia Commons (CC BY 4.0)
JACKSONVILLE, Fla. - The Jacksonville metropolitan area had approximately 802,800 nonfarm jobs in September 2026, while its unemployment rate stood at 4.5%, according to preliminary figures from the U.S. Bureau of Labor Statistics. Employment increased by just 2,400 jobs, or 0.3%, compared with September 2025, leaving the region's overall job market nearly unchanged from a year earlier. Beneath that relatively flat total, however, some industries added thousands of positions while others experienced substantial declines.
Education and health services led the region's employment gains, adding 4,300 jobs over the year, while financial activities lost 3,900 positions. Government and information employment also declined, offsetting gains in several other sectors. The contrasting trends show why the region's overall employment total does not tell the complete story of where jobs are growing or disappearing.
The metropolitan unemployment rate increased slightly from 4.4% in September 2025 to 4.5% in September 2026. That was below the area's January 2026 peak of 5.2%, but it remained higher than the rate recorded during the corresponding month a year earlier. The latest figures provide a detailed picture of employment conditions across Jacksonville and Northeast Florida.
Jacksonville Jobs and Unemployment: Numbers at a Glance
The September employment figures cover the Jacksonville metropolitan statistical area, which includes Duval, St. Johns, Clay, Nassau and Baker counties. The job counts measure nonfarm payroll employment across the metropolitan area, while unemployment rates measure a different aspect of the labor market. Both indicators are important because payroll employment can remain nearly unchanged even when the percentage of unemployed workers changes.
| Labor market measure | September 2025 | September 2026 | Change |
|---|---|---|---|
| Jacksonville metro jobs | 800,400 | 802,800 | +2,400 |
| Jacksonville unemployment | 4.4% | 4.5% | +0.1 percentage point |
| Florida unemployment | 4.2% | 4.4% | +0.2 percentage points |
| U.S. unemployment | 4.4% | 4.2% | -0.2 percentage points |
| Jacksonville private-sector jobs | 719,100 | 723,400 | +4,300 |
| Jacksonville government jobs | 81,300 | 79,400 | -1,900 |
Source: U.S. Bureau of Labor Statistics. September 2026 figures are preliminary. Metro payroll employment and metro and county unemployment rates shown here are not seasonally adjusted; Florida and U.S. unemployment rates are seasonally adjusted.
Jacksonville's 4.5% unemployment rate was 0.1 percentage point above Florida's 4.4% rate and 0.3 percentage points above the national rate of 4.2%. The comparison comes with an important limitation because the metropolitan rate is not seasonally adjusted, while the national rate is adjusted for normal seasonal patterns. Comparing the same month in successive years provides a more useful view of changes in the local labor market.
Year Over Year: More Jobs, but Higher Unemployment
Jacksonville's nonfarm payroll employment increased from 800,400 in September 2025 to 802,800 in September 2026. The addition of 2,400 jobs represented growth of approximately 0.3%, a small change relative to the metropolitan area's total employment. The result suggests a relatively stable overall payroll count rather than rapid employment expansion.
Seasonally adjusted employment figures show a somewhat different increase, from 801,700 jobs in September 2025 to 805,200 in September 2026. That represents a gain of 3,500 jobs, or approximately 0.44%, over the same period. Both measures show modest employment growth despite differences in how seasonal changes are handled.
The seasonally adjusted monthly figures also show that employment declined between August and September 2026. Jacksonville had 806,700 seasonally adjusted jobs in August, compared with 805,200 in September, a decrease of 1,500 positions. That monthly reduction was approximately 0.19%, although the metropolitan area still had more jobs than during September of the previous year.
Unemployment followed a more pronounced pattern over the period covered by the data. Jacksonville's rate was 3.7% in January 2025, fell to 3.5% in April and reached 4.4% by September. It subsequently climbed to 5.1% in November and 4.7% in December, with no October 2025 unemployment figure available.
The rate reached 5.2% in January 2026, the highest monthly figure in the period covered by the fact sheet. It then declined to 5.0% in February and 4.7% in March before fluctuating between 4.7% and 4.9% from April through August. September's preliminary 4.5% reading was below those recent monthly figures.
The October 2025 unemployment figure is missing because unemployment data were not collected during the federal shutdown, according to the BLS data provided. That means the monthly unemployment series has a gap between September and November 2025, and no October rate should be inferred from adjacent months. October 2025 payroll employment data are available, but they do not provide a substitute for the missing unemployment rate.
Across the longer period, Jacksonville's September 2026 unemployment rate was 0.8 percentage point above its January 2025 level. Florida's rate also increased between September 2025 and September 2026, while the seasonally adjusted national rate declined. These movements indicate that regional and national unemployment trends did not follow precisely the same direction.
County by County: Where Unemployment Stands
The September figures reveal relatively small differences among the four Northeast Florida counties with verified unemployment rates in the data. Each county had a higher rate than in September 2025, although the year-over-year changes were modest. All four also had lower rates in September than in August 2026.
| County | September 2025 | August 2026 | September 2026 | Annual change |
|---|---|---|---|---|
| Duval | 4.4% | 4.9% | 4.5% | +0.1 point |
| St. Johns | 4.2% | 4.7% | 4.4% | +0.2 points |
| Clay | 4.4% | 4.7% | 4.5% | +0.1 point |
| Nassau | 4.2% | 4.6% | 4.3% | +0.1 point |
Source: U.S. Bureau of Labor Statistics. All rates are not seasonally adjusted. September 2026 data are preliminary.
Duval County: The unemployment rate was 4.5% in September 2026, compared with 4.4% in September 2025. The rate declined from 4.9% in August, a reduction of 0.4 percentage point in a month. Duval matched the overall metropolitan unemployment rate in the latest report.
St. Johns County: Unemployment reached 4.4% in September, up from 4.2% a year earlier. The county's rate declined from 4.7% in August, although it remained 0.2 percentage point above its September 2025 level. St. Johns had the largest year-over-year increase among the four counties listed, measured in percentage points.
Clay County: The September unemployment rate was 4.5%, compared with 4.4% during the same month of 2025. Its August rate was 4.7%, indicating a decline of 0.2 percentage point between the two latest available months. Clay's September reading was identical to Duval's and the metropolitan area's overall rate.
Nassau County: The county recorded a September unemployment rate of 4.3%, the lowest among the four counties in the table. Its rate was 4.2% in September 2025 and 4.6% in August 2026. The latest number represents a modest annual increase despite a decline from August.
The county figures illustrate how closely unemployment rates tracked one another across Northeast Florida. The four September rates were separated by only 0.2 percentage point, ranging from 4.3% to 4.5%. That narrow spread suggests that differences in the headline unemployment rate were relatively limited across the counties examined.
Who Employs the Most: Jacksonville's Biggest Industries
Jacksonville's employment base spans trade, transportation, utilities, health care, education, professional services, hospitality, government and other industries. The BLS measures employment by industry rather than identifying individual businesses in these figures. Its September report shows that trade, transportation and utilities remained the largest broad employment sector in the metropolitan area.
| Industry | September 2026 jobs | Share of all metro jobs |
|---|---|---|
| Trade, transportation and utilities | 170,600 | 21.3% |
| Education and health services | 140,000 | 17.4% |
| Professional and business services | 117,900 | 14.7% |
| Leisure and hospitality | 93,000 | 11.6% |
| Government | 79,400 | 9.9% |
| Financial activities | 68,100 | 8.5% |
| Construction | 53,900 | 6.7% |
| Manufacturing | 36,900 | 4.6% |
| Other services | 29,200 | 3.6% |
| Information | 13,400 | 1.7% |
Source: U.S. Bureau of Labor Statistics. September 2026 preliminary figures, not seasonally adjusted. Shares are calculated against 802,800 total nonfarm jobs and rounded. The listed industries exclude the small mining and logging component.
Trade, transportation and utilities accounted for approximately 21.3% of Jacksonville's nonfarm employment, with 170,600 jobs. Education and health services followed with 140,000 positions, representing 17.4% of the total. Professional and business services ranked third with 117,900 jobs, or 14.7%.
Together, those three broad sectors accounted for more than half of the metropolitan area's employment. Their combined importance helps explain why employment changes within a relatively small number of industries can have a substantial influence on the regional total. However, their size alone does not indicate whether every occupation or business within those sectors is expanding.
Retail trade, which is included within trade, transportation and utilities, accounted for 85,700 jobs in September. That was more than the 68,100 jobs recorded across the entire financial activities sector. Retail employment should not be added separately to the industry table because doing so would count those workers twice.
Winners and Losers: Which Industries Gained or Lost Jobs
Jacksonville's strongest year-over-year employment gain came from education and health services. The sector increased from 135,700 jobs in September 2025 to 140,000 in September 2026, adding 4,300 positions. That represented growth of approximately 3.2%, making the sector the largest contributor to annual job gains among the industries examined.
Leisure and hospitality added 1,400 jobs, increasing from 91,600 to 93,000, a gain of 1.5%. Professional and business services increased by 1,300 jobs, while trade, transportation and utilities added 1,200. Manufacturing and construction recorded smaller increases of 500 and 300 jobs, respectively.
Financial activities experienced the largest employment decline, losing 3,900 jobs over the year. Employment fell from 72,000 in September 2025 to 68,100 in September 2026, representing a decrease of approximately 5.4%. This was the largest absolute decline among the major sectors included in the report.
Government employment also contracted, falling from 81,300 to 79,400 jobs, a decrease of 1,900 or approximately 2.3%. Information employment declined by 600 jobs, representing a 4.3% reduction from September 2025. Other services lost 200 jobs, while retail trade separately recorded a decline of 200 within the broader trade sector.
| Industry | Annual job change | Percentage change |
|---|---|---|
| Education and health services | +4,300 | +3.2% |
| Leisure and hospitality | +1,400 | +1.5% |
| Professional and business services | +1,300 | +1.1% |
| Trade, transportation and utilities | +1,200 | +0.7% |
| Manufacturing | +500 | +1.4% |
| Construction | +300 | +0.6% |
| Other services | -200 | -0.7% |
| Information | -600 | -4.3% |
| Government | -1,900 | -2.3% |
| Financial activities | -3,900 | -5.4% |
Source: U.S. Bureau of Labor Statistics. Changes compare September 2026 with September 2025 using not seasonally adjusted payroll employment.
The contrast between education and health services and financial activities was particularly pronounced. One sector gained 4,300 positions while the other lost 3,900, producing significantly different conditions within the same metropolitan economy. Those changes help explain why the small overall increase of 2,400 jobs can conceal much larger movements within individual industries.
Private-sector employment increased from 719,100 to 723,400 jobs over the year, while government employment declined from 81,300 to 79,400. The private-sector gain of 4,300 jobs exceeded the overall metropolitan increase because of the reduction in government employment. Together, private and government employment accounted for the reported 802,800 nonfarm jobs in September.
What It Means for Job Seekers, Employers and Renters
For job seekers, the central finding is that Jacksonville's job market was not moving uniformly across industries. Education and health services showed measurable annual growth, while financial activities, government and information had fewer positions than a year earlier. Those differences provide useful context when evaluating the local employment landscape, although payroll statistics do not reveal how many vacancies are currently available.
The overall unemployment rate also requires careful interpretation. A 4.5% rate describes the proportion of the labor force classified as unemployed under the measure, not the percentage of jobs that are vacant or the likelihood that any individual applicant will receive an offer. The BLS figures in this report do not provide occupation-specific openings, hiring requirements or applicant competition.
For employers, the industry data illustrate a metropolitan economy in which employment is expanding in some categories while contracting in others. The limited 0.3% annual increase in total nonfarm payrolls indicates that regional employment growth was modest despite the larger gains in selected sectors. The figures do not establish why particular industries added or lost jobs, and they cannot independently determine whether a change resulted from hiring decisions, business conditions or other factors.
For renters and households dependent on employment income, the numbers offer a broad measure of regional labor market conditions. A relatively flat payroll total combined with slightly higher year-over-year unemployment may be relevant to understanding employment uncertainty across the area. However, these statistics do not measure wages, rent increases, household income or housing affordability, so they cannot establish whether residents are financially better or worse off.
The comparison with Florida and the United States also deserves context. Jacksonville's unemployment rate was slightly above both benchmarks in September, but the local and national series use different seasonal adjustment methods. The year-over-year comparisons therefore provide a more consistent starting point than interpreting a single month's difference as proof of stronger or weaker economic performance.
Where to Get Job Help in Northeast Florida
Residents looking for employment assistance can use CareerSource Northeast Florida, which maintains an online resource at careersourcenortheastflorida.com. The organization is a regional starting point for job-related assistance and employment information. Readers should consult its website for current services and available resources rather than assuming that the regional employment totals represent open positions.
Another resource is Employ Florida, the state's employment website. Job seekers can visit the site to explore its current employment resources and opportunities. The BLS industry figures presented in this report should be treated as background information rather than a live listing of vacancies on either website.
For continuing coverage of employment and economic issues, readers can visit the Jax Times Jobs and Money page. The section provides a destination for the publication's jobs and money coverage. Readers comparing future unemployment reports should pay attention to the reporting month, geographic area and whether the data have been revised.
About the Data: September Figures Are Preliminary
The figures in this report come from the U.S. Bureau of Labor Statistics Public Data API and cover payroll employment and unemployment statistics through September 2026. The September figures are designated preliminary by the BLS and may change when revised data are published. As a result, future reports could show somewhat different employment totals, industry changes or unemployment rates.
Metropolitan payroll figures were examined using both seasonally adjusted and not seasonally adjusted series, while the industry breakdown uses not seasonally adjusted data. Metropolitan and county unemployment rates presented here are not seasonally adjusted, unlike the Florida and U.S. unemployment benchmarks. For the clearest local annual comparison, this report emphasizes September 2026 against September 2025 rather than relying solely on changes between consecutive months.
The latest report leaves Jacksonville with approximately 803,000 nonfarm jobs, slightly more than a year earlier, and an unemployment rate of 4.5%. The overall employment total suggests limited growth, but the industry breakdown reveals substantial differences between expanding and contracting sectors. Those contrasting trends are the central finding of Northeast Florida's September 2026 labor market data.
Source: U.S. Bureau of Labor Statistics

News organizations may republish this story with credit. See our guidelines.
Know someone who'd want to read this? Email it to a friend.
Own a Jacksonville business? Introductory ad rates from $125/month. See ad options Follow Jax Times on FacebookLocal news, events and people, in your feed every day.Most read this week
- JSO Opens New Headquarters at 532 Riverside Ave.: 346,000 Square Feet, 11 Floors and More Than $20 Million
- Duval's 1-Mill School Tax Renewal and 3 School Board Races on the Nov. 3 Ballot: Who Is Running and What's at Stake
- Florida's Lemon Law in 5 Steps: The 24-Month Window, 3 Repair Tries and How Drivers Get a Refund or New Car
- Jacksonville Building Permits in 7 Steps: When You Need One, Fence Height Limits and the $250 Fine for Skipping It
- How to Register a Boat in Northeast Florida in 6 Steps: Fees From $5.50 to $189.75 and a 30-Day Deadline
More stories
 Finance Jacksonville vs. St. Augustine Sales Tax in 2026: 4 Counties Compared, From 6.5% to 7.5%
 Business Starting a Business in Jacksonville in 2026: 8 Steps to Form an LLC, From $125 in State Fees to the $400 Late Penalty
 Business Jacksonville Airport's 11 Airlines Ranked: Allegiant Leads With 14 Nonstop Destinations, Breeze Has 11
 Local Jacksonville's 22 Career Fields Ranked by Pay in 2026: From $17.57 to $65.97 an Hour
Comments
Be respectful. No personal attacks, hate speech, spam or anyone's private information. Every comment is reviewed before it appears. Comment rules
No comments yet. Be the first to share your thoughts.